The Nameplate Lied: Real-World AGM Battery Capacity, Sulfation, and What Happens When You Push a Solar System to Its Limits
- Matthew Wheeler
- May 27
- 5 min read


I wake up. The first Sunbloc stress test was just completed the night before. Other than the voltage being uncharacteristically low the batteries operated without failure. A low SoC event but completely recoverable. I check the controller. It's in float. That shouldn't be happening at all. Even worse it's only midday. The batteries should be swallowing up all the energy possible after a night of deep discharge. Their was more to the state of the batteries. One stress test shouldn't precipitate this result.
THE BUILD
This is a small off-grid installation designed as a teaching system. My mother wanted to understand what it meant to own and operate solar before committing to something larger.
The system:
1× Canadian Solar 445W module
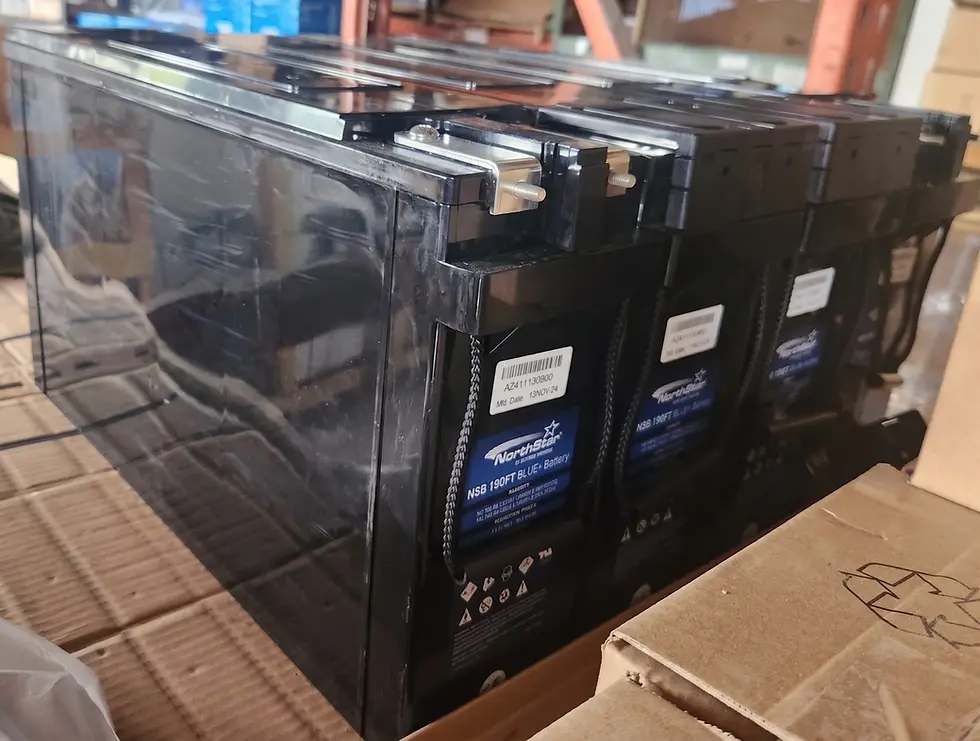
2× Northstar 190Ah AGM batteries, wired in series
1× Victron SmartSolar 100|30 MPPT charge controller
1× Victron Phoenix 800W inverter
Simple, quality components, a robust setup. AGM stands for Absorbent Glass Mat. It's a sealed lead-acid battery chemistry where the electrolyte is suspended in fiberglass matting rather than free-flooding the cell. AGM batteries charge fast, handle deep discharges better than flooded lead-acid, and require no maintenance access.
The two batteries wired in series produce a 24V nominal bank. Each battery is rated at 190Ah at a C/20 discharge rate. C/20 means the battery is discharged over 20 hours, normally a slow, gentle draw. Multiplying volts by amp-hours gives watt-hours. 12V × 190Ah = 2,280Wh per battery. Two batteries is 4,560Wh total.
That number would not survive the stress test.
LOAD AND CALCULATIONS
The load for the stress test was a PlayStation 5 and a monitor. Measured draw: 250 to 300 watts. SoC is state of charge, the percentage of usable energy remaining in the battery. A healthy AGM battery should not be discharged below 50% SoC regularly without accelerating wear. A single deep discharge event to 20 or 30% is survivable.
Over 12 hours at 300W, the maximum total draw would be 3,600Wh. At 250W, 3,000Wh. Against a 4,560Wh bank, that puts the batteries somewhere between 22 and 35% SoC at sunrise. Low but manageable. If the assumptions are correct I pass the stress test easily.
THE DAY OF THE TEST
On the day of the test, the weather wasn't ideal. Clouds obscured the sun for most of the day. Although a little worrying, the batteries had reached absorption at 1:30 PM. Absorption is the second stage of a three-stage charge cycle: bulk, absorption, float. Absorption is where the controller holds a fixed voltage and lets current taper as the battery fills. Reaching absorption by early afternoon with a cloudy sky was promising. Even with shading from clouds causing the voltage to drop throughout the day. The assumption was that the batteries were near 95% SoC heading into the test. There was no way to verify that. This build had no dedicated battery monitor. No SmartShunt or Flexnet DC, devices that track amp-hours in and out of a battery over time to calculate a real SoC percentage. Without one, all you have is voltage, and voltage is an imprecise, temperature-dependent, load-sensitive number that varies depending on conditions.
THE TEST
The stream goes live at sundown, around 8 PM. The PS5 powers on. The load settles between 250 and 300W. And the first warning arrives immediately: battery voltage drops to 24.5V under load.
For a healthy 24V AGM bank at 95% SoC, that number should be closer to 25V. Concerning but not catastrophic. The night is cold, the batteries are in an uninsulated storage shed on my mother's property, and cold temperatures reduce battery capacity and depress voltage. I note it and keep going.
Two colleagues join the stream. One works with Indian Health Services. Another goes back to my time working in California. The conversation is productive and important: daily life and challenges on a reservation, the particular weight of rural energy insecurity, the way an off-grid solar system stops being a product and starts being infrastructure when the grid isn't an option. Both sign off after a couple hours and I'm left to continue the test for the rest of the night.
The voltage drops too quickly. At 1:30 AM, the controller's low voltage disconnect activates at 23.5V, cutting the load output to protect the batteries. LVD or low voltage disconnect, is an automatic shutoff that triggers when battery voltage falls to a preset threshold. The stream goes offline.
The controller's LVD threshold can't be reconfigured. So I rewire the inverter input directly to the battery terminals, bypassing the controller's load output. Voltage immediately recovers to 24.22V. I give the system two hours of rest. Then I continue the test.
The batteries hold through the rest of the night. As the sun rises, the voltage reads 23.1V under load. Dangerously low. The PS5 shuts down. The stream ends.
CONCLUSIONS FROM THE DATA
The total draw recorded through the night: 2,375Wh. Less than the test demanded, because of the LVD event and the rest period. And yet the batteries were nearly empty. At 23.1V under load, they were sitting at approximately 15% SoC.
The nameplate math said they should have been at 50%.
The gap between those two numbers requires investigation. The batteries didn't have 4,560Wh of usable capacity. They had something closer to 3,000Wh. Almost 30% less than their rated specification. That capacity wasn't consumed during the test. It was simply missing.
Parameter | Expected | Actual |
Battery Capacity | 4560 Wh | ~3000 Wh |
Total Load Draw | 3000 Wh | 2375 Wh |
SoC at Sunrise | ~50% | ~15% |
Voltage at Sunrise | 24.1V | 23.1V |
Charge State | Bulk | Float |
The system looked fine going into that night. The controller had been hitting absorption and floating every day. Without a battery monitor, there was no way to know those stages were happening faster than they should have, which signals reduced capacity. The battery was cycling through charge stages normally and silently losing the amount of energy stored.
CHECKING ON THE SYSTEM
I fall asleep. When I wake up and check the controller it's in float by midday after a night that should have the system in bulk charge for nearly the whole day. The batteries are rejecting the charge. They're behaving like they're full when they aren't because internally, they can't accept any more electrons.
What follows this article is an engineering breakdown of why: the cloud edge effect, internal resistance, the relationship between temperature and battery chemistry, and plate sulfation in lead-acid cells. Sulfation is the buildup of lead sulfate crystals on battery plates; it's the primary cause of permanent capacity loss in AGM and other lead-acid batteries, and it accumulates invisibly over time.
The stress test didn't cause these batteries to fail. It revealed the failure mode was already in motion. THE TAKEAWAY People install off-grid solar often without understanding the chemistry underneath them. A controller reaching float reads as success. Voltage in range reads as success. The system powering the load seems healthy. None of those signals told the full story here. The only thing that would have caught this earlier was data: a battery monitor tracking amp-hours over weeks and months, showing capacity degradation in numbers rather than symptoms.
Off-grid solar isn't an appliance. It's architecture. It has failure modes that don't announce themselves and degradation curves that look like normal operation until they don't. This series will give people the knowledge to read their systems accurately. The next article covers the recovery: how you bring a sulfated AGM battery back from the edge, and how these batteries are operating in a healthy state as I write this.
Comments